Is 1099 Really Cheaper for Motor Carriers? Methods and data
ProHRHQ, a division of North Star Group, Inc. Data as of October 3, 2026. This page explains how the study was done and gives the results tables, charts and data for anyone who wants to check, cite or reuse them.
Read the paper (PDF, 6 pages) · Download the data and charts (ZIP) · How to cite
Permanent record: DOI 10.5281/zenodo.23191494 (Zenodo, CERN).
Findings
Carriers that advertise only 1099 company-driver jobs offer 17.3% more weekly pay than comparable carriers that advertise only W-2 jobs, after accounting for route, fleet size, miles per truck, region, years in business, safety record, preferred-partner status, days out and home time. The 95% interval is 14.6% to 20.4%. At the median solo W-2 offer of $1,285 a week, that is about $222 a week, against about $98 of employer Social Security and Medicare avoided.
Carriers that advertise both kinds of job behave differently: of 91 carriers with equivalent 1099 and W-2 jobs, 74 (81%) advertise the same pay for both. The median difference is $0.
Data source
Every live job ad on the Lanefinder truck-driver job board (lanefinder.com/jobs), and the full job page behind each one, collected October 3, 2026: 5,712 ads, with no failed page fetches. Each ad states a weekly gross pay range and whether the job is W-2 company driver, 1099 contract driver or owner-operator. The collector identified itself as ProHRHQ research and gave a contact address.
Each ad was matched by USDOT number to Federal Motor Carrier Safety Administration records for fleet size, miles, authority age and safety measures. 3,437 of 3,460 carriers matched.
Definitions
Pay is the midpoint of the ad's stated weekly gross pay range. Company-truck jobs are solo jobs with owner-operator ads removed, along with any ad mentioning a lease, rental, the driver's own truck, own authority, escrow or a down payment. Carrier groups come from each carrier's solo company-truck ads: all 1099, all W-2, or both. An equivalent pair is one 1099 ad and one W-2 ad at the same carrier with the same route type, overlapping freight, weekly miles stated on both and within 10%, and the same home-time terms.
The raw gap
| Segment | 1099 ads | 1099 median | W-2 ads | W-2 median | 1099 higher by |
|---|---|---|---|---|---|
| All ads | 1,580 | $1,772 | 3,548 | $1,300 | 36.3% |
| Solo company-truck | 1,309 | $1,700 | 3,334 | $1,285 | 32.3% |
| Team | 222 | $3,550 | 188 | $3,000 | 18.3% |
| Solo, over the road | 820 | $1,800 | 886 | $1,450 | 24.1% |
| Solo, regional | 306 | $1,500 | 938 | $1,350 | 11.1% |
| Solo, local | 134 | $1,250 | 1,238 | $1,125 | 11.1% |
| Solo, semi-local | 49 | $1,300 | 272 | $1,225 | 6.1% |
Weighted by the route mix of 1099 jobs, the solo gap is 19.5%.
Comparing carriers that look alike
The controlled comparison uses 4,540 solo company-truck ads: 894 carriers advertising only 1099 (1,123 ads) and 2,100 carriers advertising only W-2 (3,078 ads). The 120 carriers advertising both are analyzed separately below.
Controls: route; fleet size (power units, six bands); miles per truck (three bands plus unknown); Census region; authority age from the FMCSA add date (under 3, 3 to 10, over 10 years); out-of-service rate (driver plus vehicle out-of-service inspections divided by inspections over 24 months, for carriers with at least five inspections); safety grade; three-year crashes per power unit; Lanefinder preferred-partner status; expected days out; home time.
Regression
Ordinary least squares on the logarithm of weekly advertised pay, with an indicator for 1099-only carriers and categorical controls added in steps. The premium is exp(coefficient) minus 1. The interval comes from 500 bootstrap resamples of carriers.
| Controls (cumulative) | 1099-only premium |
|---|---|
| none | 33.1% |
| route | 21.0% |
| + fleet size, miles per truck, region | 24.3% |
| + authority age | 20.3% |
| + safety: OOS rate, grade, crashes | 19.8% |
| + preferred partner | 18.8% |
| + expected days out and home time | 17.3% (14.6% to 20.4%) |
Matching check
A second method without a model: carriers sorted into cells that match on the controls, 1099-only median minus W-2-only median inside each cell that contains both groups, weighted by 1099 ads.
| Matched on (cumulative) | Premium per week | Premium | 1099 ads matched |
|---|---|---|---|
| none | $446 | 35.5% | 1,123 |
| route | $274 | 19.7% | 1,123 |
| fleet size | $344 | 25.2% | 1,123 |
| miles per truck | $339 | 24.5% | 1,118 |
| region | $347 | 25.2% | 1,114 |
| authority age | $311 | 22.1% | 1,036 |
| safety (OOS rate) | $299 | 21.1% | 884 |
| preferred partner | $292 | 20.8% | 773 |
The two methods land between 17% and 21%, so the result does not depend on one technique.
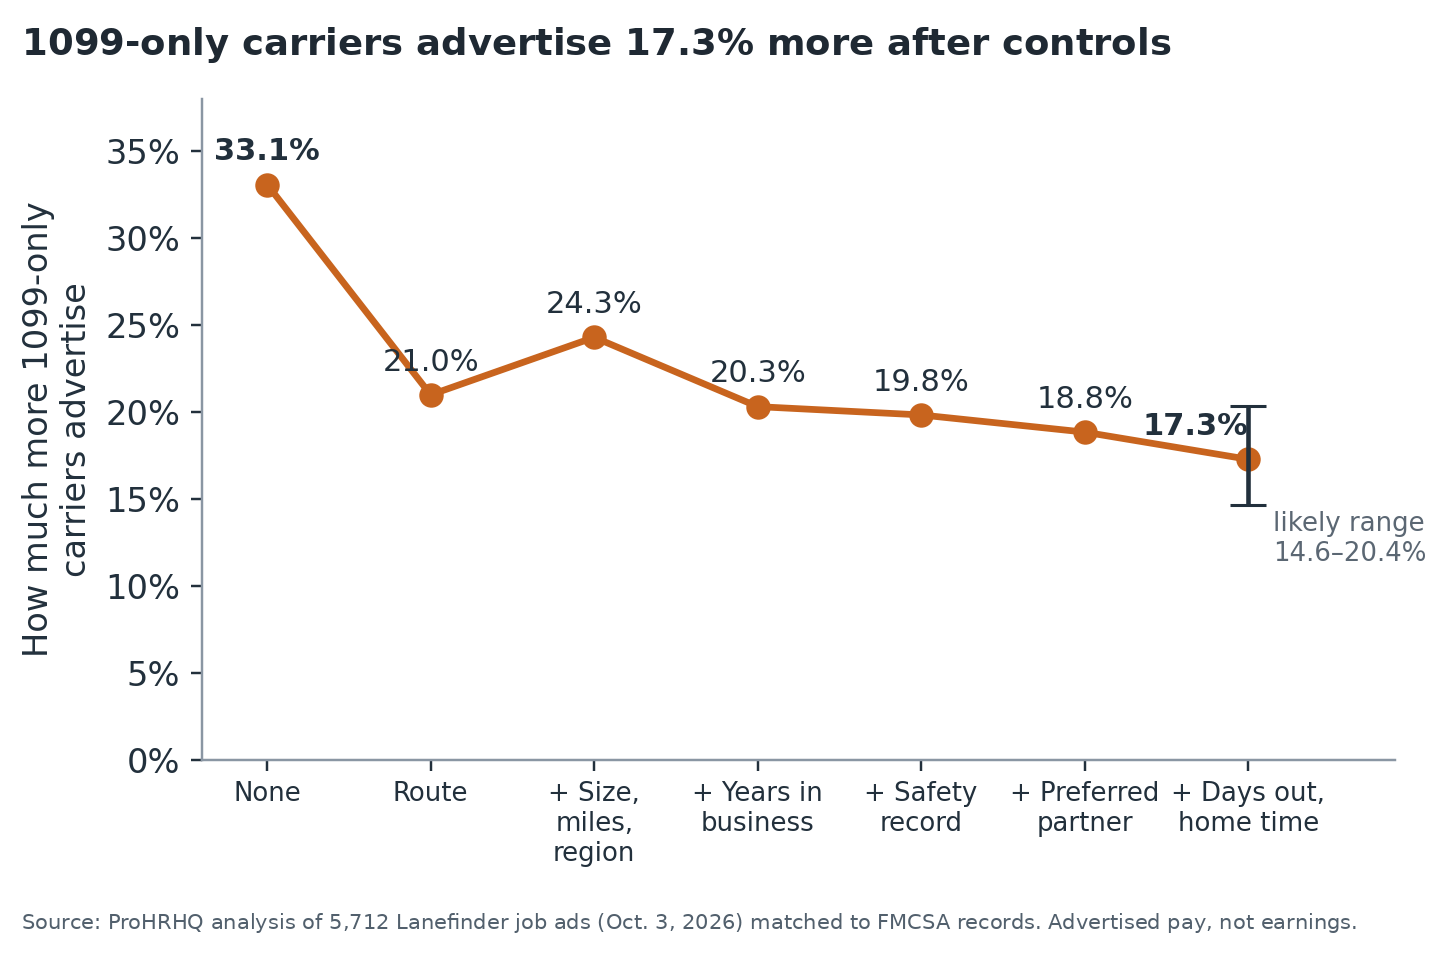
1099-only carriers advertise 17.3% more after controls
Vertical axis: How much more 1099-only carriers advertise, 0% to 35%.
None: 33.1%
Route: 21.0%
+ Size, miles, region: 24.3%
+ Years in business: 20.3%
+ Safety record: 19.8%
+ Preferred partner: 18.8%
+ Days out, home time: 17.3%, likely range 14.6–20.4%
Source: ProHRHQ analysis of 5,712 Lanefinder job ads (Oct. 3, 2026) matched to FMCSA records. Advertised pay, not earnings.
Same-carrier comparison
120 carriers advertised both solo 1099 and W-2 company-truck jobs (339 ads); 91 had at least one equivalent pair (116 pairs).
| Equivalent jobs at the same carrier | Carriers |
|---|---|
| Same pay | 74 |
| 1099 pays more | 15 |
| 1099 pays less | 2 |
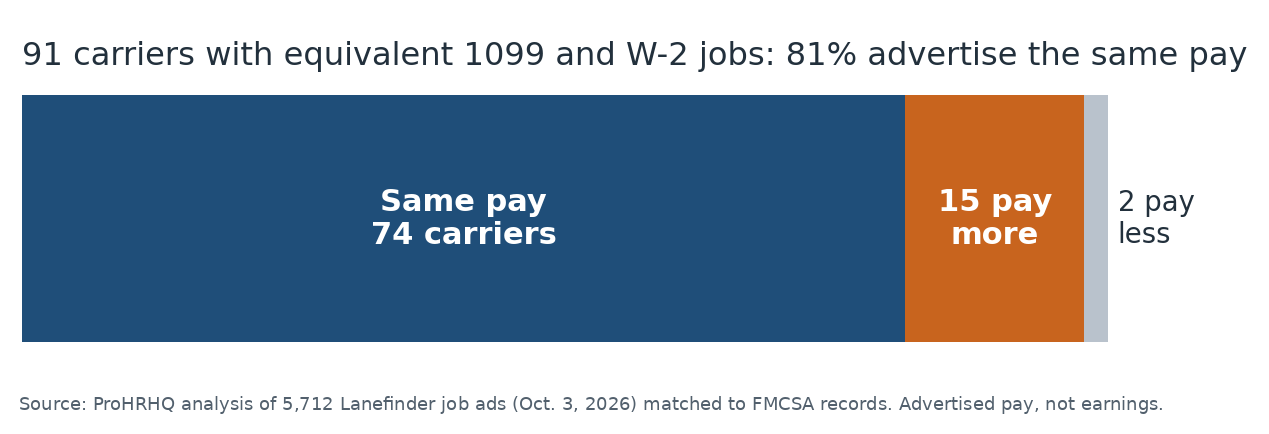
91 carriers with equivalent 1099 and W-2 jobs: 81% advertise the same pay
Same pay: 74 carriers
15 pay more
2 pay less
Source: ProHRHQ analysis of 5,712 Lanefinder job ads (Oct. 3, 2026) matched to FMCSA records. Advertised pay, not earnings.
Dollars and taxes
Employer Social Security and Medicare is 7.65% of pay (IRS Topic 751). The driver's added self-employment tax is approximated as 7.65% of 92.35% of weekly pay (IRS self-employment tax).
| Weekly, per driver, at the solo W-2 median ($1,285) | Amount |
|---|---|
| Extra cash in a comparable 1099 offer | $222 |
| Employer Social Security and Medicare avoided | $98 |
| Premium left after the tax saving | $124 |
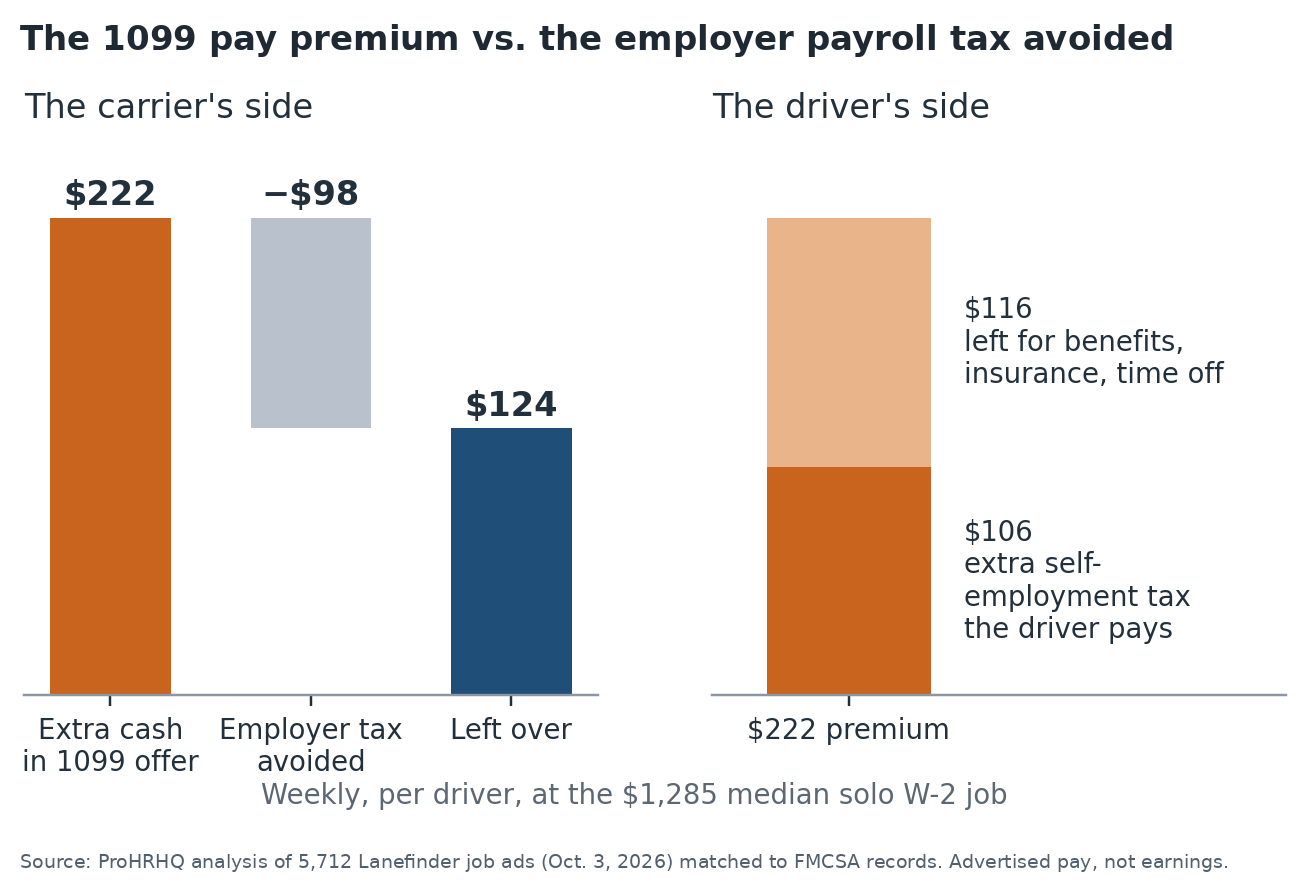
The 1099 pay premium vs. the employer payroll tax avoided
The carrier's side: Extra cash in 1099 offer: $222. Employer tax avoided: −$98. Left over: $124.
The driver's side: $222 premium. $106 extra self-employment tax the driver pays. $116 left for benefits, insurance, time off.
Weekly, per driver, at the $1,285 median solo W-2 job
Source: ProHRHQ analysis of 5,712 Lanefinder job ads (Oct. 3, 2026) matched to FMCSA records. Advertised pay, not earnings.
Limits
- Ads are offers, not paychecks; the study does not show what drivers earn.
- Actual miles driven at each carrier, equipment age, dispatch quality and reputation are not measured and may explain some of the gap.
- It covers carriers that are hiring and advertise on Lanefinder, not every carrier.
- It does not show that any carrier has misclassified anyone, or that converting to W-2 would save money for a given carrier.
- Benefits were not used: Lanefinder shows the same Benefits section on a carrier's 1099 and W-2 ads.
Data and charts
Aggregate results only. Ad text, carrier names, USDOT numbers and contact details are not published; the full dataset and code are retained by ProHRHQ, and specific questions about them are welcome.
- market_comparison.csv: Ad counts and median weekly pay, 1099 vs W-2, by segment and route
- carrier_groups.csv: Carriers and ads in the matched solo sample
- matching_ladder.csv: Exact-matching premium as controls are added
- regression_ladder.csv: Regression premium as controls are added, with the 95% interval
- same_carrier_pairs.csv: Same-carrier equivalent 1099 and W-2 jobs
- economics.csv: Dollar arithmetic at the solo W-2 median
- README.txt: Data dictionary, definitions, controls and limits
- is-1099-really-cheaper-data.zip: all of the above plus the three charts
Charts carry their own title and source line and may be republished with credit. Data and charts are licensed CC BY 4.0: credit ProHRHQ and link to this page.
How to cite
ProHRHQ. (2026). Is 1099 really cheaper for motor carriers? What 5,712 truck-driver job ads show about 1099 and W-2 pay [Report and dataset]. North Star Group, Inc. https://doi.org/10.5281/zenodo.23191494
Questions about the data: Michael Hoffman, michaelh@nsgia.com, 701-770-9118.